

I wrote this article because I was trying to solve my own problems. I wanted to:
- Find more keyword opportunities in the market that competitors couldn't
- Figure out how to prioritize where to focus my effort and resources
- Calculate traffic and revenue projections for my TAM
- Have data to back me up and get buy in from leadership
- Plan exactly which content to create and in what order to get the most impact
- Measure performance over time so I could report back on it and adjust course as needed
What’s Wrong with Most Content Gaps?
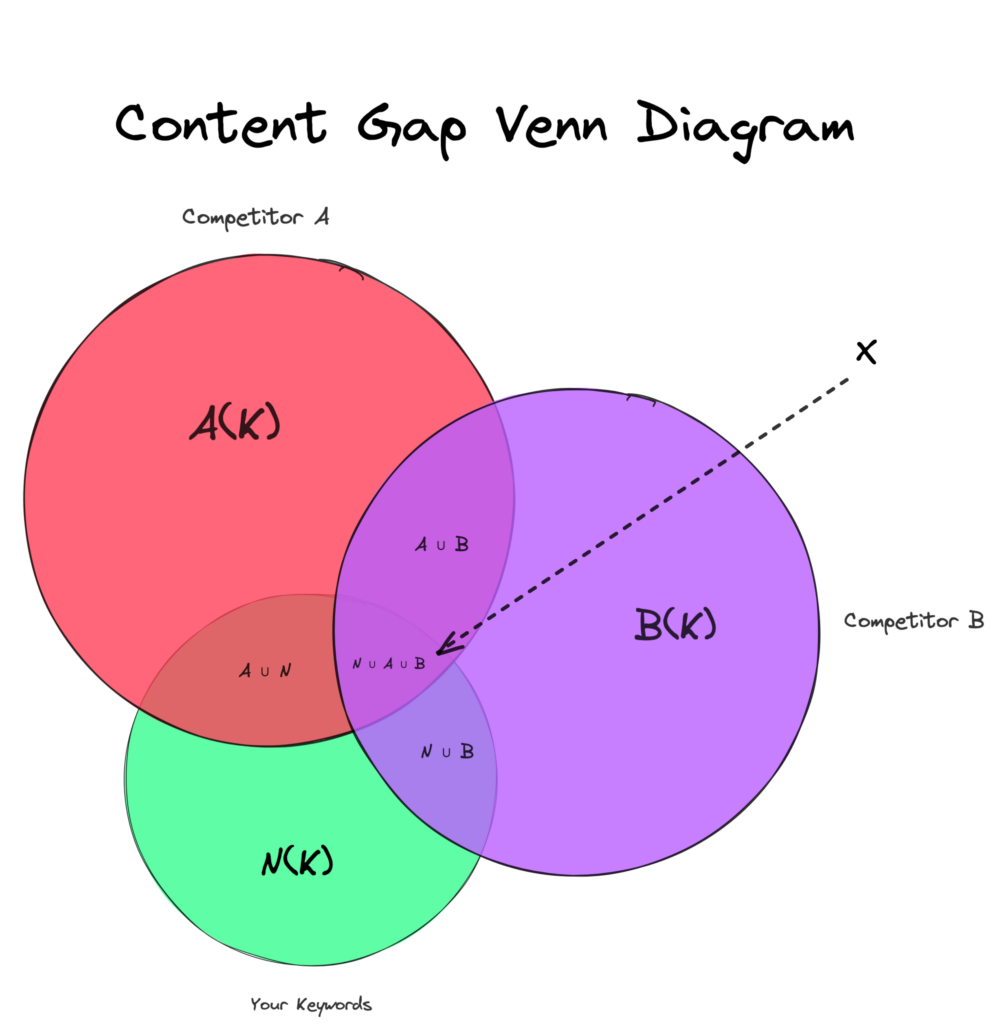
The standard approach to finding content gaps involves taking some set of competitors (C), determining all of the relevant keywords they rank for C(K), the keywords for which your website ranks N(K), the overlap between these sets (X), and the gaps for which you do not (G).
Let’s break that down:
- C = Your competitors
- C(K) = The relevant keywords your competitor’s rank for
- N(K) = The keywords you rank for
- X = The overlap (or union) of keywords you and your competitor’s rank for
- G = The keywords your competitor’s rank for that you do not
The problem with this approach is that it fails to truly capture the full picture of things— the total addressable market.
You end up missing out on a ton of valuable opportunities—especially when everyone else is taking the same approach.
This was something we were continually bothered by when crafting plans for content calendars because we didn’t want to just create a plan that was “good enough.”
We wanted to be able to develop and execute plans that would simultaneously elevate our clients and something the competition wouldn't be able to easily replicate.
If we consider the TAM when approaching a content gap analysis, we can find significantly more topics for which neither ourselves nor our considered competitors are ranking.

Benefits of a TAM-G Analysis
More Revenue Generating Opportunities in Less Time
Ahrefs' content gap report can enable you to find a lot of opportunities but they operate using multiple databases and often miss out on a lot.
If we use Ahrefs Content Gap to analyze the gaps ClickUp has for topics related to project management compared to Asana, Todoist, Wrike, Toggl, Teamwork, Monday, and Scoro, we’ll find that there are 1,940 keywords that Clickup doesn’t rank for that at least one of the other competitors does.
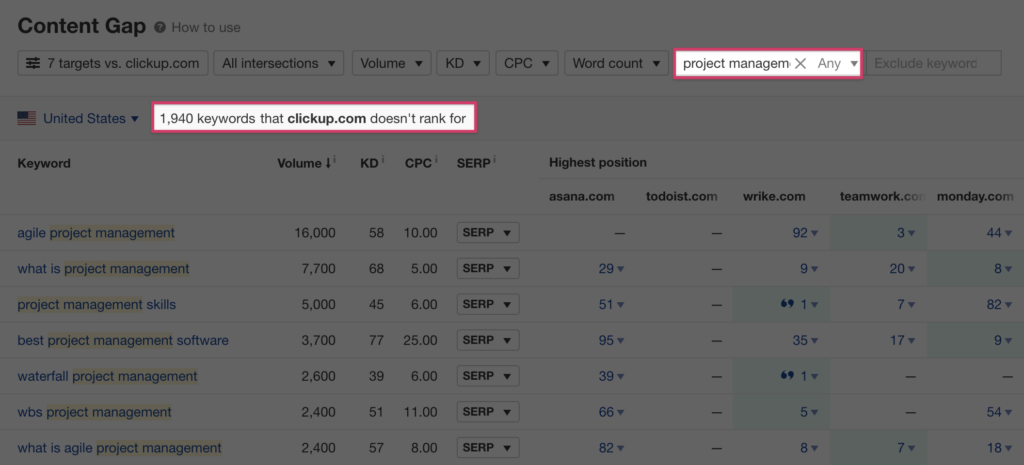
If we were to check the actual SERPs we’ll often find that ClickUp does actually rank for some percentage of these keywords and Ahrefs isn’t reporting them because it hasn’t updated its database.
Even if it did have a completely up-to-date database of rankings for these keywords, it would still only be a fraction of the total set of keywords related to project management.
Using Ahrefs Keywords Explorer we can check the Matching terms report using the Terms match mode we see there are 187,882 keywords related to project management in Ahrefs keyword database.
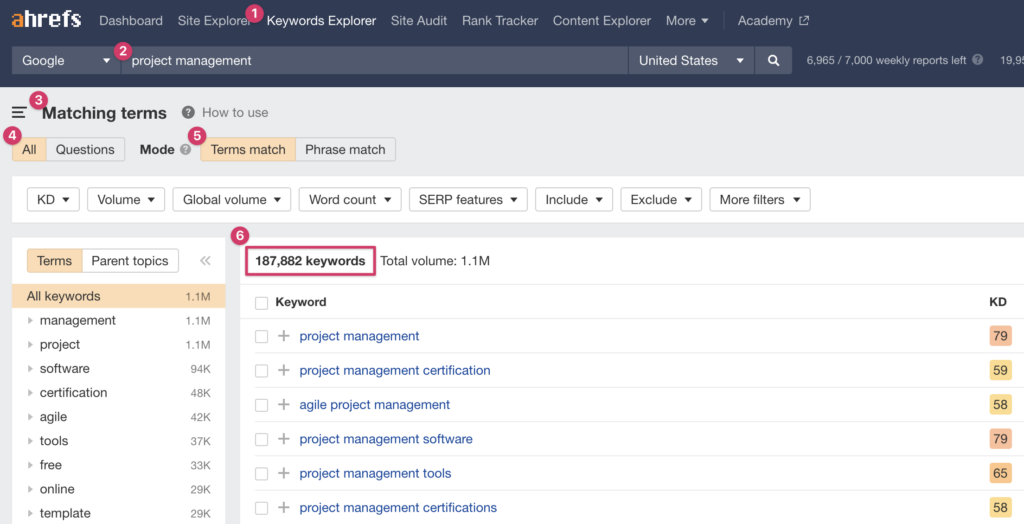
There are significantly more keywords in this set than we found in the Content Gap report (9000%+) primarily because the Content Gap report only registers keywords that at least one of the supplied competing domains ranked for that ClickUp did not.

Since we cannot input every competitor (Ahrefs caps the limit at 10) and because there’s no guarantee that the competitors we supply will rank for every possible keyword related to project management, there are bound to be gaps in our data.
ClickUp likely ranks for some percentage of these 187,882 topics that we found using Keywords Explorer, but when we look closer, it doesn’t seem like much.
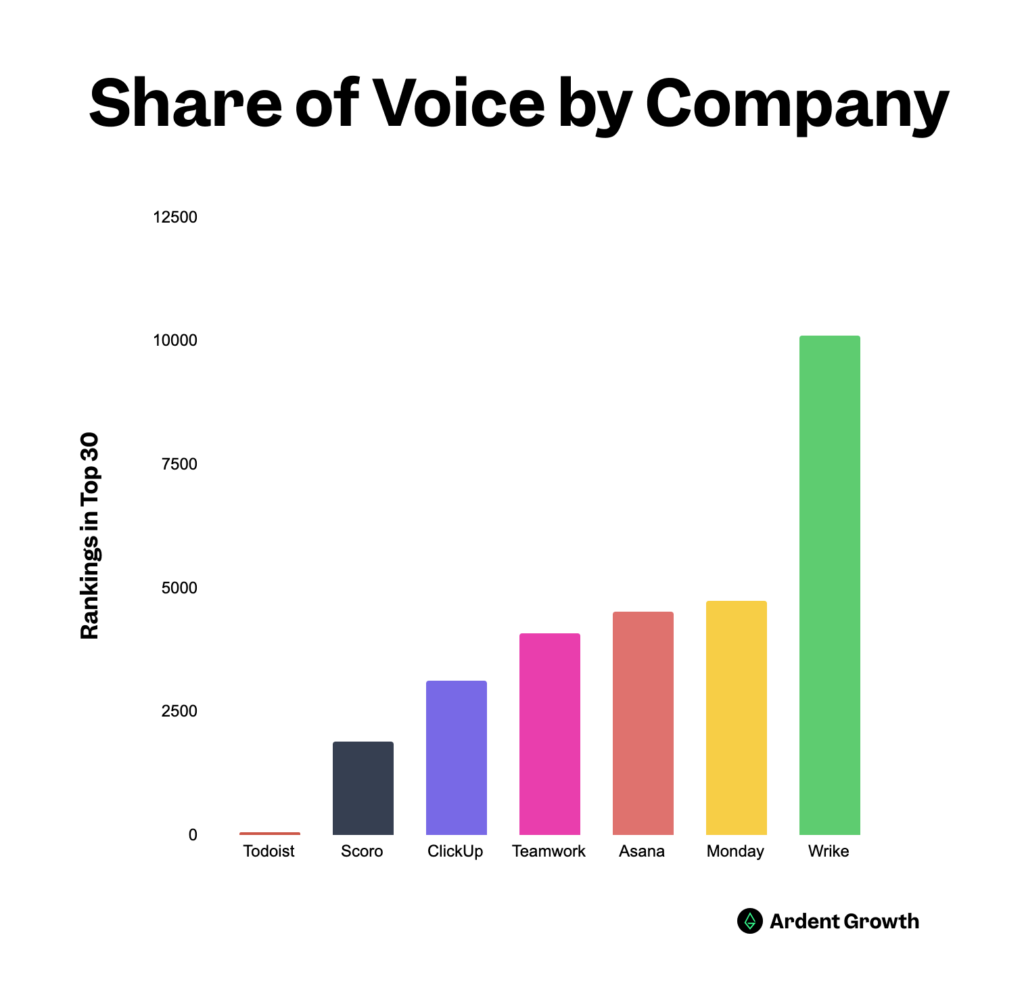
If we check Ahrefs Traffic share by domains report, we’ll find ClickUp gets less than 1% of the total organic traffic these keywords send to websites every month—putting Clickup in the 79th position overall in this market.
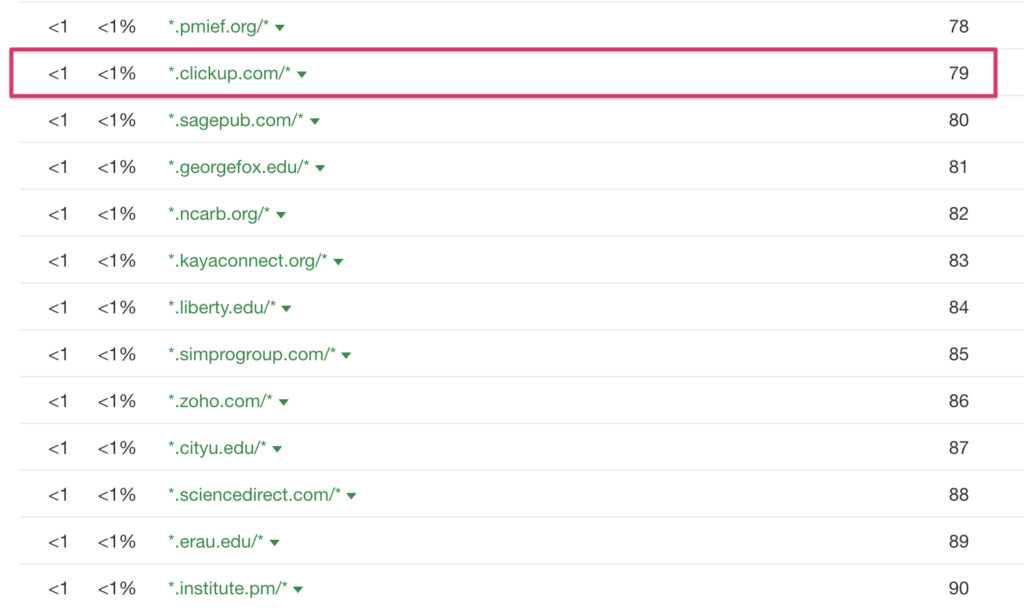
This isn’t necessarily a bad thing though. If we compare the other domains in our consideration set, we’ll see that many of them aren’t doing well either (confirming what we predicted earlier about the Content Gap report’s underwhelming numbers).
- Monday: 8% (Rank 6)
- Wrike: 2% (Rank 13)
- Teamwork: <1% (Rank 19)
- Asana: <1% (Rank 53)
- ClickUp: <1% (Rank 79)
- Todoist: 0% (Rank ∅)
- Toggl: 0% (Rank ∅)
- Scoro: 0% (Rank ∅)
We might expect this to some extent, especially since every one of these tools wouldn’t classify itself as a project management tool (e.g. Todoist positions itself as a productivity app).

Nonetheless, we consistently find this same trend when we follow this same process across other relevant topics that these companies might want to compete for:
- productivity
- time tracking
- goal tracking
- team collaboration
- task management
- work management
- resource management
- executive summary/summaries
- project briefs
- editorial calendar
- gantt charts
- kanban boards
With tools like these, we can come up with thousands of categories and intents aligning with the jobs to be done framework that would be lucrative to rank for.
Every single keyword returned won’t be relevant though.
And that’s okay.
That’s where automation can help cut through the noise using topic clustering, relevancy scoring, and personalized priority sorting. Things we’ll elaborate more on in a bit.
Immediate Insights
One quick way to cut down on the noise is to set the filter in Ahrefs to only show you keywords with a monthly search volume of at least 10.
Doing so, our set of 187,882 keywords drops to 25,565. The main downside to this approach is the fact that many thousands of those keywords actually get much more than 10 searches per month. Anyone who’s spent enough time comparing Ahrefs data to Search Console will know that.
Note: We don’t filter them out when working on a client project. We grab everything we possibly can because if you don’t, can you say you’re really considering the total addressable market?
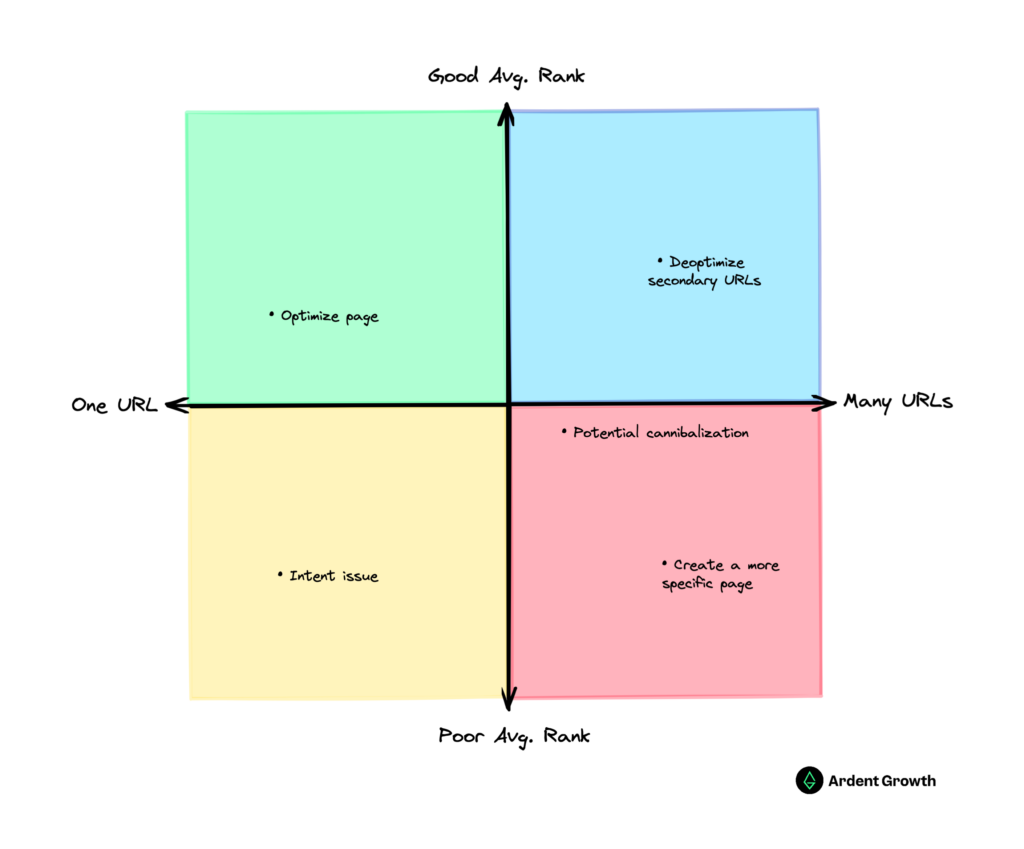
The TAM-G can provide a variety of insights to act on, including:
- Content gaps at the market level
- Content gaps at the site level
- Keyword gaps at the page level
- Search intent alignment issues
- Cannibalization issues
- Internal linking opportunities
Let’s quickly find a few and demonstrate how to address them by looking at the data.
Insight #1: When a Related Page is Warranted
Here we see that ClickUp has a URL ranking within this cluster about simple project management (where the intent is highly focused on software and tools).

At first glance, it may appear that ClickUp is doing great within this cluster. But they’re not. With an average rank of 9 across this entire cluster, that’s indicative that the content page isn’t aligned with the primary search intent for the main keyword.
Important: This does not always mean the content of the page needs to be updated though.
The intent of this page is a list of the best free project management options to choose from. That intent aligns with a separate main keyword in our cluster: free project management software—which that very same URL is performing great for with an average rank of 4 across the entire set of variant keywords.
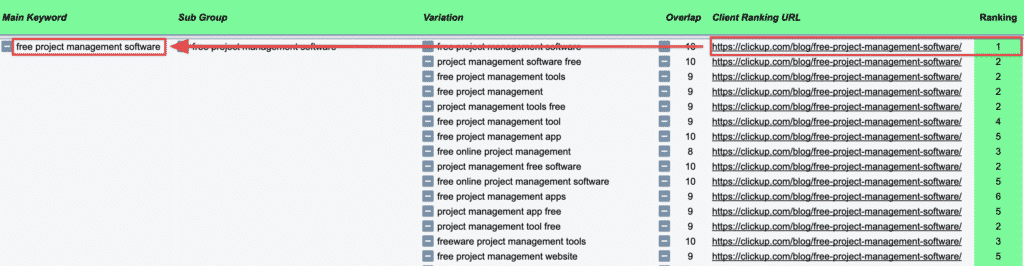
Because of this, ClickUp doesn’t need to optimize the /free-project-management-software/ URL for simple project management. A new page targeting that term specifically is called for instead.
Insight #2: When a Page Needs an Update
ClickUp is performing okay within the agile project management tools cluster but the average rank still isn’t too great.
Similar to the preceding example, the average rank is sitting at the bottom of the first page, except this URL is the right URL for this topic.
If we look at the page itself (namely the H1) we see the writers intended to list the top agile project management tools.

Looking within the cluster, we can see that top agile project management tools exists as one of the variants (with an average monthly search volume of 30).
Higher in the cluster we also see best agile project management tools has more search volume.
If we look at the SERPs for the main keyword agile project management tools, it becomes immediately apparent that Google is showing a preference for the word best.

More confirmation is added when we look at the SERPs for top agile project management tools we see Google showing the same preference:
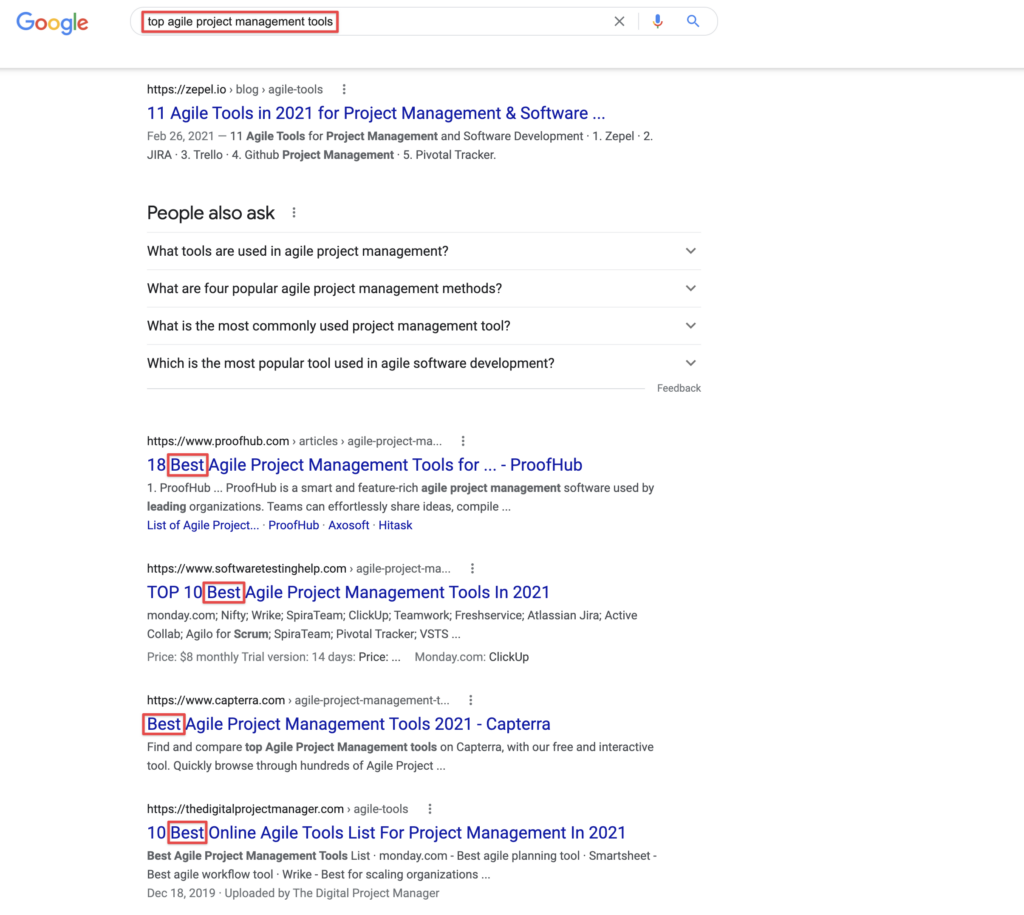
It may sound absurdly simple but some quick on-page adjustments to this URL’s title tag, H1, etc. might be enough to push it up half a page if not more.
Sometimes it’s just that easy.
Something that takes less than 1 minute to do can easily 10x the traffic that page gets every month, increasing free-trial signups and bringing more qualified users into their sales funnel to convert into paid users.
It takes a bit of discernment to interpret the output of our clustering algorithm but once you know what to look for, quick wins like these number in the hundreds if not thousands.
It’s fun creating new content that’s bold and impactful (and we’ll get to that in a second), but it’s the boring stuff that makes businesses money. SEO and content marketing exist to support the overarching business strategy—not just their own goals.
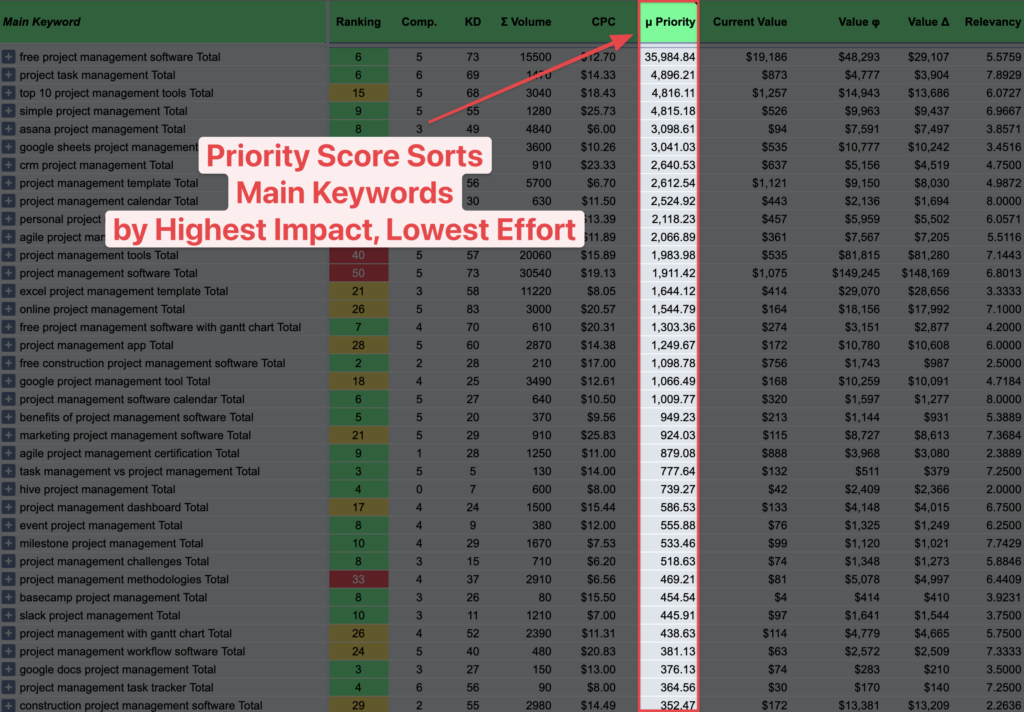
Priority Score: Personalized Difficulty
When we first began developing the TAM-G it was rough making sense of all the data. We needed to know where to start. We never liked generalized metrics like keyword difficulty because they were never truly representative of true difficulty because they weren’t relative.
To solve that, we derived a metric we call (unimaginatively) priority score. Our priority score enables us to sort the data in such a way that the most high-impact opportunities with the lowest effort bubble up to the top.
We calculate priority based on a variety of factors that include:
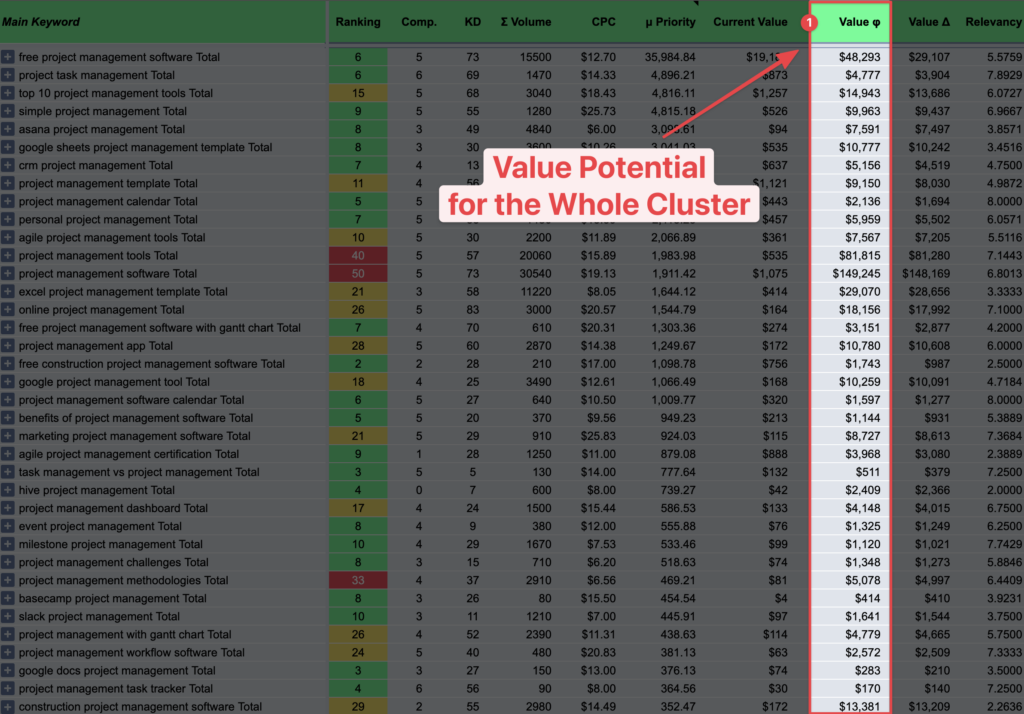
- The value of the entire cluster (something that the standard approach of looking at keywords in isolation cannot provide).
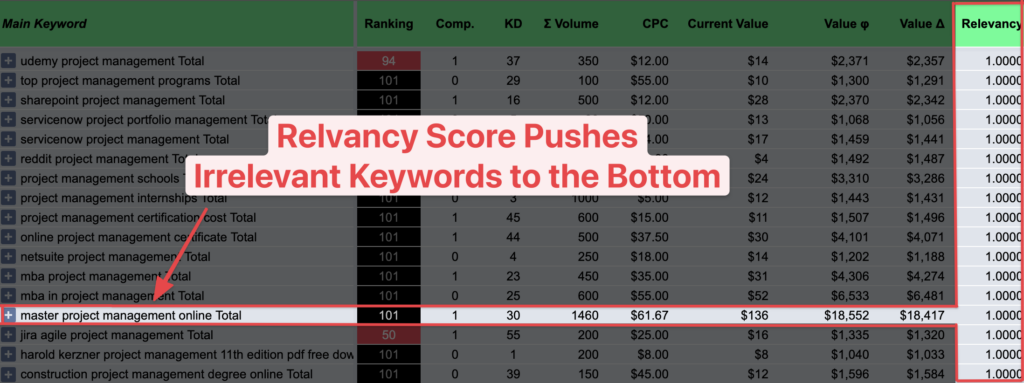
- The relevancy of the cluster to your brand, preventing highly-valuable keywords that are irrelevant from distracting you.
- Your current topical authority across the cluster—bypassing generic KD values with the best leading indicator of authority: actual rankings.
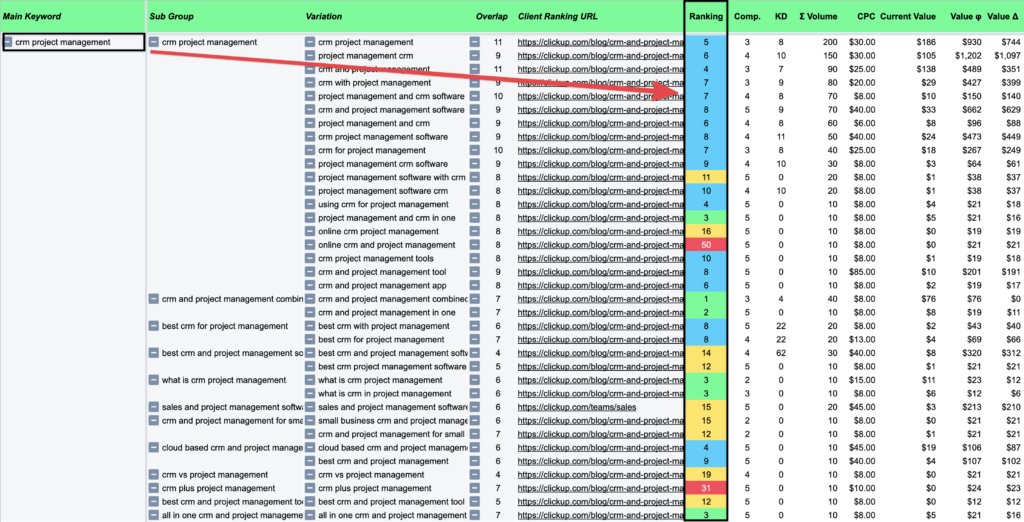
For example, clusters like crm project management show up higher in the pivot table because there’s a lot of value left to be captured here and ClickUp is already ranking on the first page for many of the variant keywords in the set.
If Google is already ranking you on the first page for a good percentage of the keywords within a cluster then you know Google views your content as relevant enough to rank for the other, lower-ranking keywords.
A little bit of on-page optimization for those terms or a new paragraph or two if you’re not specifically addressing the topic in your content usually takes 15-20 minutes for someone on a content team and creates valuable increment lift when compounded over months.
This priority score is what enables us to grab anything and everything when assessing our total addressable market without worrying about losing critical data needed to paint the full picture of value and traffic opportunity or having to sift through mounds of irrelevant data.
Traffic & Revenue Forecasts
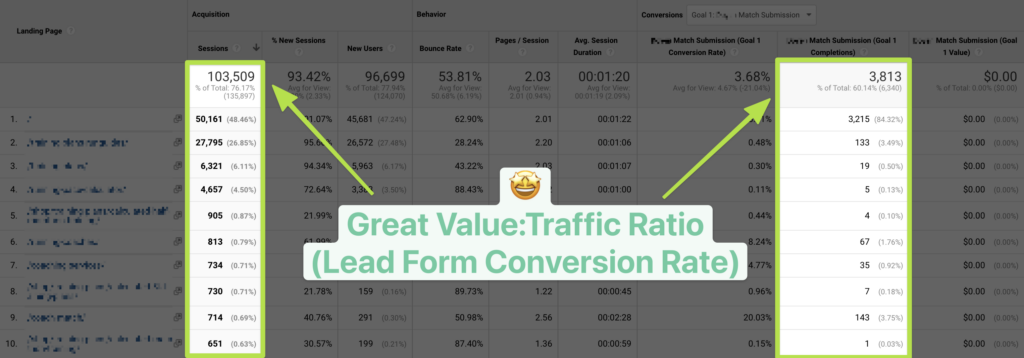
Traffic and value are far better indicators of success than search volume. If you pick topics based on search volume, you’re opening yourself to unnecessary risks and wasted budget.
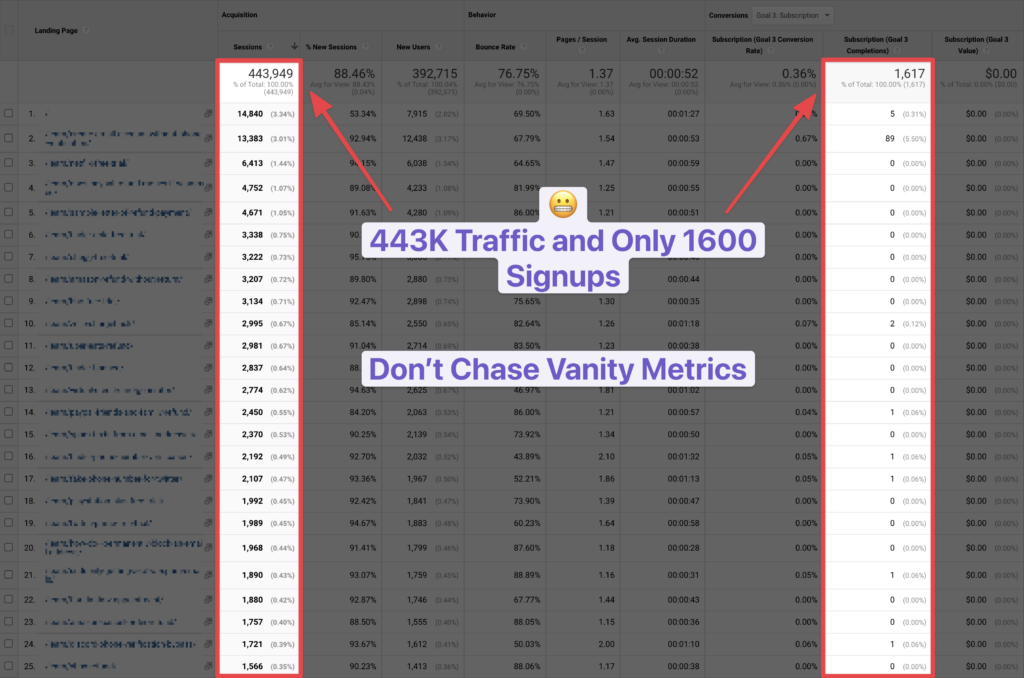
All the volume in the world won’t matter if it doesn’t drive traffic and, more importantly, if that traffic isn’t valuable. The example (B2B SaaS) above shows a clear example of what things look like when you focus too much on volume and not enough on conversion potential.
Contrast this with the ratio for this B2B coaching website that gets 1/4 the traffic but over 2x the conversions.
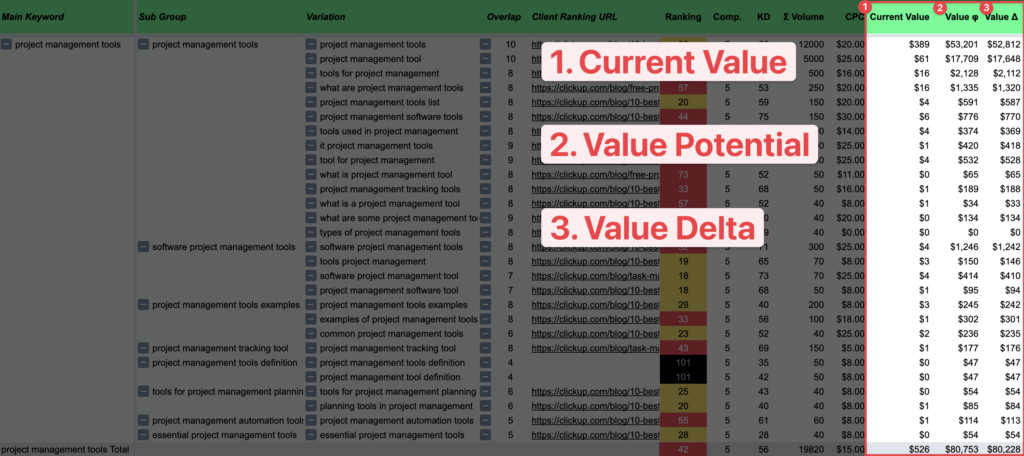
Using click-through rates that take SERP features into account, we’re able to plot out several useful page-level metrics for a given cluster:
- Estimates for current traffic and its current value (what you’re lacking)
- Estimated traffic potential and value potential (what you have now)
- The delta between each respectively (what you could have)
These are useful when justifying whether or not certain page-level keyword gaps are worth going after or not. It’s not uncommon to see a high-volume keyword that looks nice but doesn’t bring much value.
Having value to anchor yourself to makes it much easier to stay focused and avoid chasing vanity metrics for the sake of fat graphs.
Note: These numbers can be refined and made more accurate if you have properly configured analytics data.
Getting Buy-in from Executives
Being able to point at a set of recommendations and tie potential value (especially when you can show your competitors currently have it) is very useful when convincing executives.
What’s easier, trying to get approval for dev resources by saying it’ll help you rank higher or coming to the table armed with ROI projections?
These initiatives will require $x resources and result in \$y incremental gain and post \$z risk if we ignore them.
Confidently Plan Content Calendars
If your goal is to get more qualified visitors from search engines, knowing which topics to add to an upcoming content calendar becomes a breeze once you determine which topics map to existing URLs on the site.

Having topics clustered and sorted by priority means you can go straight down the list and add things to the queue without having to worry about cannibalization, how long they’ll take to rank, and whether they’ll be worth it or not.

Subgroups & Themes
If you haven’t noticed, the output of the TAM-G includes three levels of keyword groups:
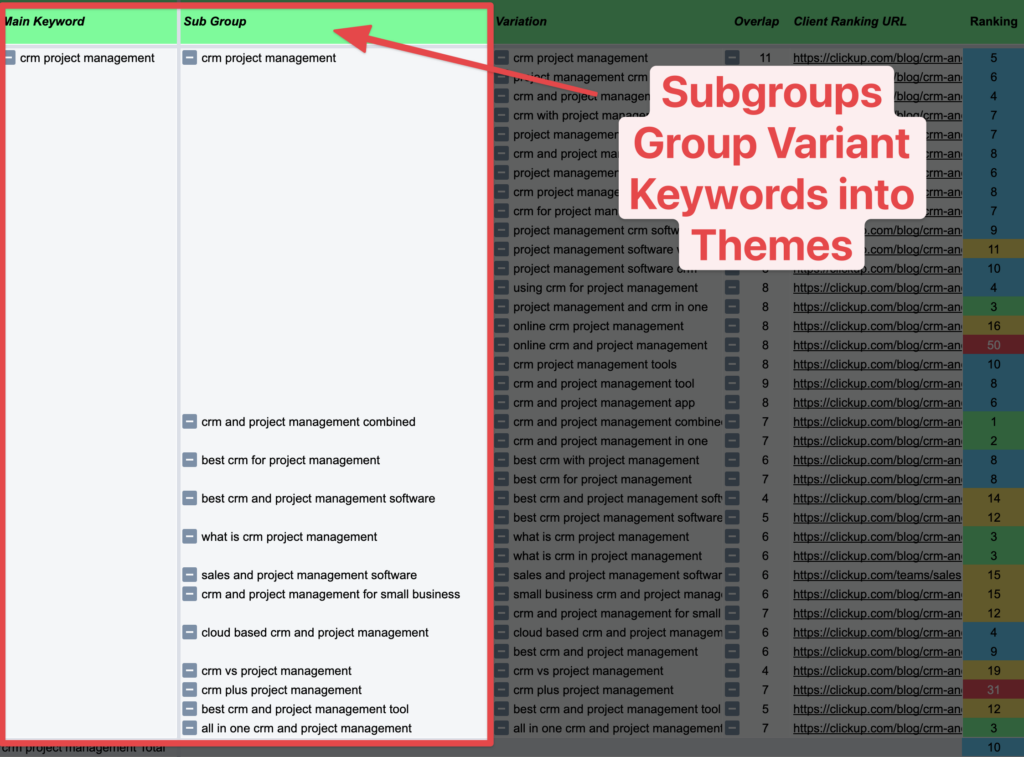
- Main keyword: this is your primary topic for the page (e.g. the H1)
- Variants: these are all the keywords that share the same intent with that main (i.e. they do not need separate pages).
- Subgroups: this is a secondary level of sorting within each main that acts as a way to group variants together thematically.
The utility that comes from this is twofold:
- It makes it easier to scan through the data for each main keyword without having to pause and process every single variant keyword.
- It acts as a general guideline for the core themes they should consider when crafting subheadings in an article.
It’s worth noting, however, that writers are not bound to these themes found in the subgroups. The writer can and should make their own modifications and decisions when developing their outline and writing their article to ensure the end result aligns with the brand and strategy. That’s their job.
For folks who like to optimize content before publishing, this isn’t a replacement for content optimization tools like Clearscope either. We still use Clearscope to see how well we’ve covered the topic and recommend everyone else do the same.
If you aren’t using Clearscope (not an affiliate link—the tool is just that great), you owe it to yourself to check it out. It’s worth every dollar.
Internal Linking Opportunities
By filtering the main keyword column using a seed term (like project management) we can look at all the URLs ranking throughout the pivot table and know exactly which pages can be internally linked together.
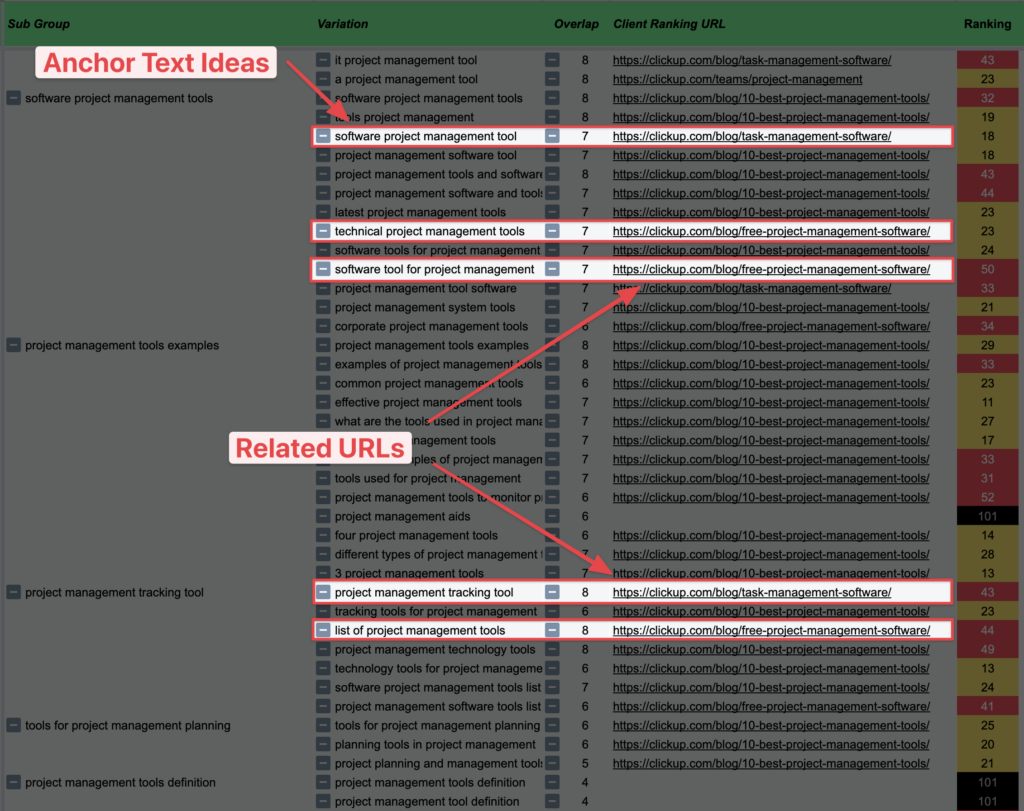
If you’ve ever had trouble coming up with varied anchor text for internal links, you won’t have that problem anymore. Simply looking through the list of variants will provide dozens of choices to select from.
We like to prioritize the ones we want to rank higher. It’s far easier to build relevancy for that term through an internal link than it is to acquire a new external link.
You’ll also see plenty of main keywords that have multiple URLs ranking for the variant terms within their set.
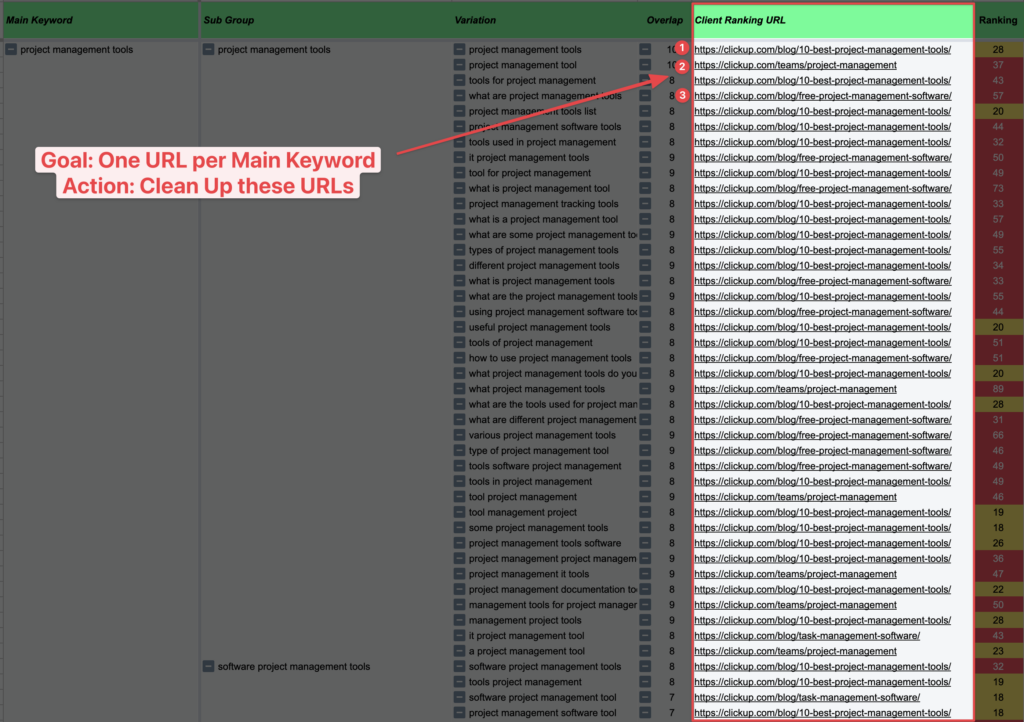
You’ll usually want to clean this up and aim for one main keyword per one URL, but it’s worth pointing out that instances like these are some of the most powerful to internally link together and help boost topical authority a ton.
Tracking Performance Over Time
We often rerun the TAM-G every 90 days or so to see how things have evolved.
It’s nice to see:
- The right URLs rank for the right main keywords
- Additional expansion gained into new topics
- The capture of market share from competitors when you overtake them on the SERPs
We like to use Accuranker to track things as it’s one of the few rank trackers out there that lets you assign a preferred URL for the keywords you track. Ahrefs has a similar feature now, too.
This really helps track the cleanup of potential cannibalization issues and the result of adding new pages to the hub.
You don’t have to track every single keyword though—that would cost a ton. Instead, track the main keyword and a handful of its highest volume subtopics. Use tags in Accuranker to make it easier to sort and group them together (we like to use the main keyword as the tag).
Adding your competitors to Accuranker also makes it easy to show how the actions implemented directly benefitted your site at the expense of the competition.
I know everyone isn’t hyper-competitive but your C-Suite probably is. Search is a zero-sum game. To pretend otherwise is either naïve at best or negligent at worst.
Get a TAM Gap Analysis for Your Industry
If you’d rather have someone build one of these for you, we can do that. We’ll handle everything from start to production for you: customer research, keyword research, URL mapping, optimization, content planning, and brief creation.
Just reach out. 👋